|
|
|
Features |
|
The
help file/user manual
(CQXClient.pdf) available on the Documents
page contains a very detailed description of each of the
features in the program and how to use them so it would be redundant to
repeat a lot of that description here. However, as a preview of what's
in the user manual, some of the features described on the Overview
page will be
illustrated with some screen shots and a brief description. The
description follows a typical sequence involving the following steps: Trip
Planning
Build County Line Crossing Data Validate Crossing Data Perform Timing Analysis GPS Panel Staying on Track Make QSOs Finalize Logs Make QSLs Posting Your Mobile Log on Google Maps Publishing QSO Party Planned Operations Operating Multiple Concurrent QSO Parties Tracking your spelling progress Trip PlanningCQ/X provides a dialog for doing a preliminary trip plan as a simple sequence of counties using an outline map of the state(s) showing each county. The following screen shot shows the main part of the dialog including a portion of the map window.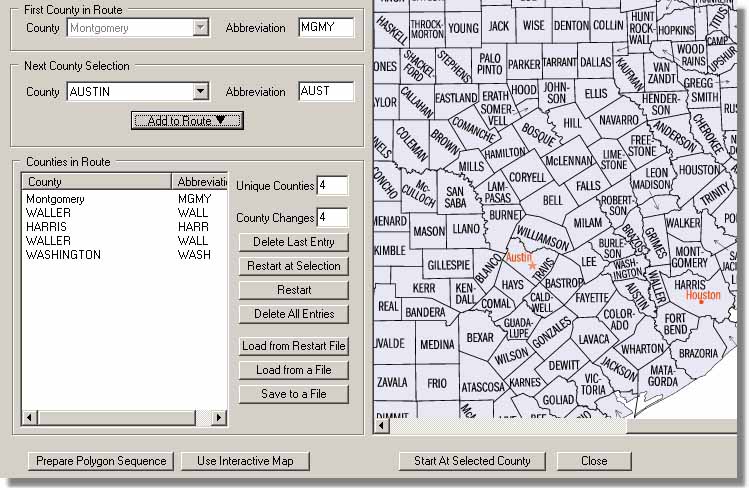 The user starts by choosing a first county and then adds counties to create a sequential list of counties in the order in which they will be activated. The counties listed in the next county selection drop down are only those counties that are adjacent to the most recent county added to the list. The map serves as a reference but since it is only an outline there is, of course, no guarantee that roads actually exist that will allow the user to carry out the plan in a convenient way. So, after coming up with a preliminary plan, the next step is to see if it will work and for that it is convenient to use a mapping program like Streets and Trips (S&T). County lines are shown in S&T but it is useful to highlight them and for this the button labeled Prepare Polygon Sequence allows the user to prepare a series of files containing the shape of each of the selected counties. This is the same data that is used in the automatic county detection logic. This sequence of files can then be imported into S&T for viewing and determining an actual road-by-road plan for the trip and, if desired, marking the lat/lon of each of the county line crossings. The above dialog can also be useful for those users that, for whatever reason, do not plan to use a GPS and the automatic county detection feature for changing counties. For these users the sequence of counties selected in the above dialog is exported to a list which is used to manage the messages and logging function as the trip progresses. In this case the user selects a starting county and then as the trip progresses a user-assigned function key is pressed to advance through the list of counties. Another function key can be assigned the task of moving backward through the counties. Top Preparing County Line Crossing DataIf a GPS is going to be used and it is desired to have an estimate of the distance and time to the next county then it is necessary to provide a list of county line crossings to CQ/X. There are three methods for doing this, all documented in the help file and supporting documents. By far the least labor-intensive method is to use Streets & Trips along with Google Maps to draw your route. Lat/lon information from the Google Map is then downloaded to CQ/X and analyzed to determine all of the county line crossing points and to build the file of county line crossing information. A side benefit of this method is that the resulting real-time distance calculations are based on the actual drive path. Here's an example for the Louisiana QSO Party.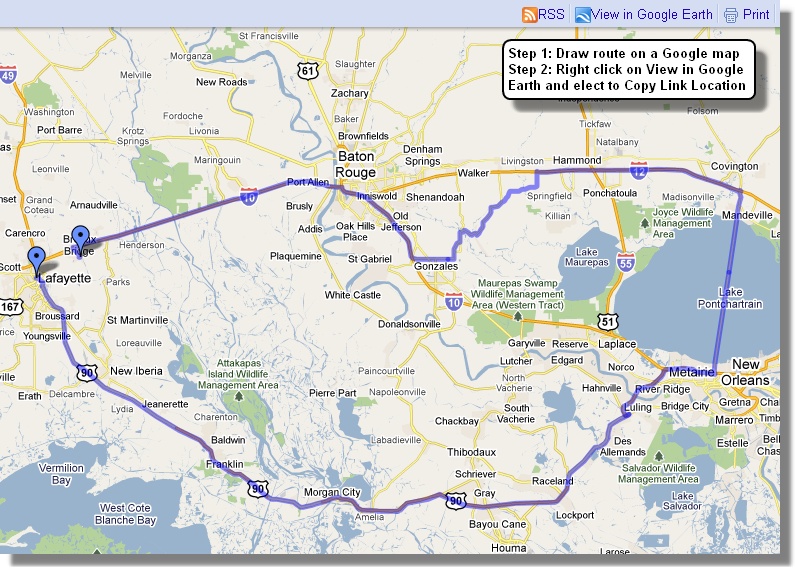 After the map is drawn and the link location has been copied the following dialog is used to set up CQ/X to find the county line crossings and to write the results into specified files. 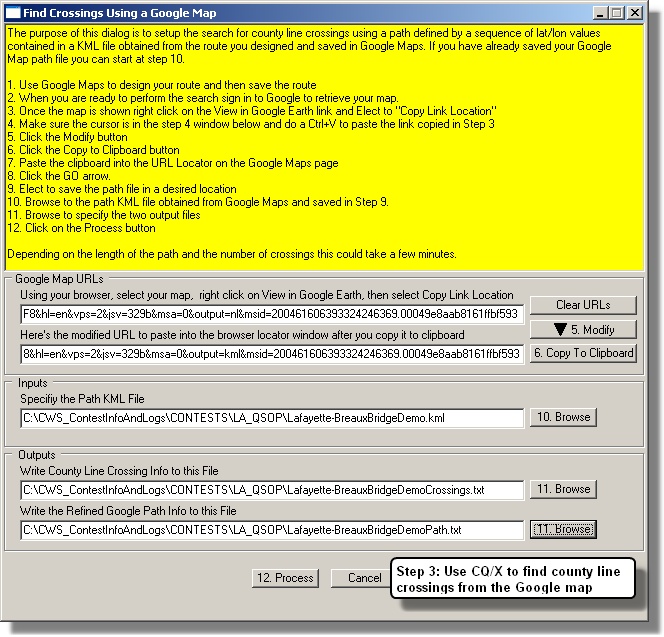 After a few seconds the process completes and the crossings found are displayed in the following dialog. At the user's option he may fill in the Highway notations. 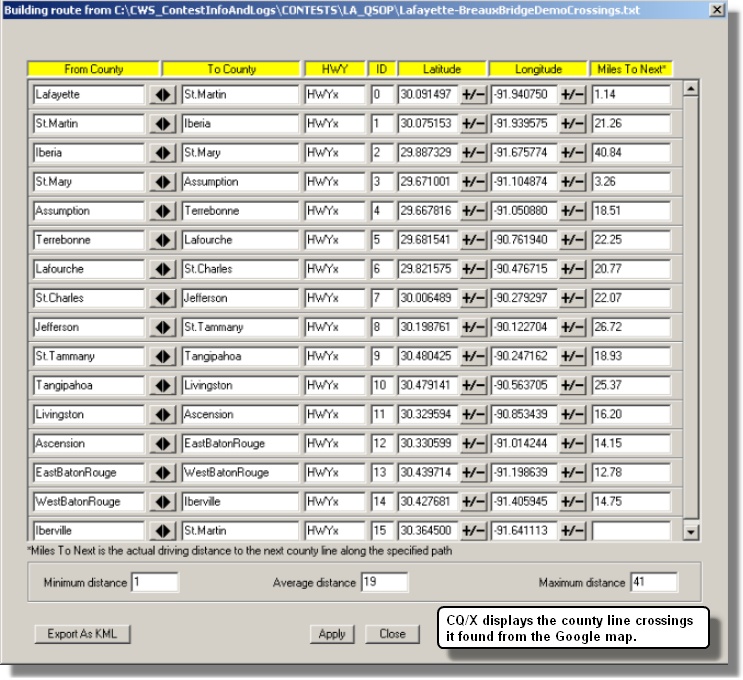 Once the Apply button is pressed the county line crossings will be used by CQ/X and the associated data will be used in all distance calculations including distance and time to the next county line crossing and to specified waypoints. Several examples showing the resulting crossings found by CQ/X are shown on the Route Plans page. Top Importing and Validating County Line Crossing DataIf you have built the file of county line crossings by hand you must then import it into CQ/X for validation using a menu item. CQ/X checks the file for reasonable lat/lon for the given state/region, checks to make sure the counties appear in the right sequence, and checks for proper spelling of the county names. An example of the resulting dialog is shown below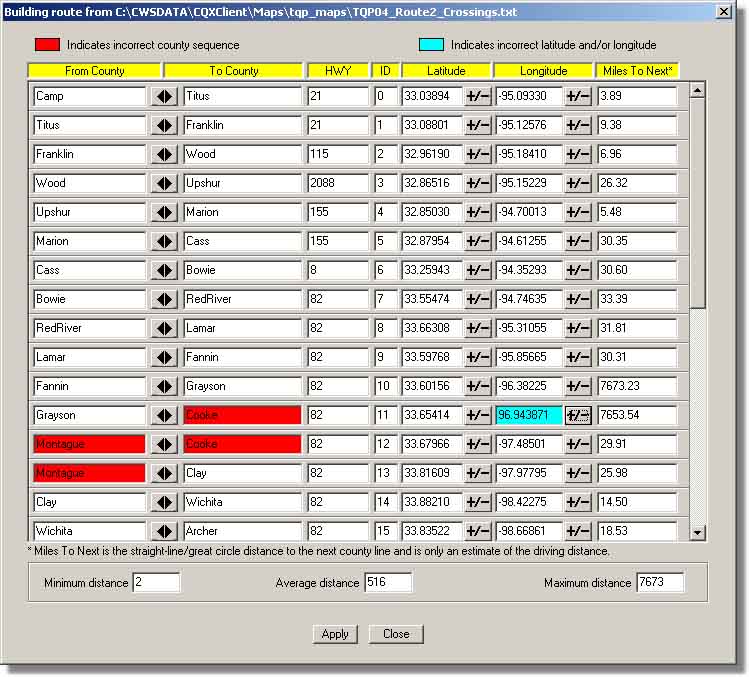 In this example the file has failed validation by having the wrong from-to relationship for the Montague-Cooke county line crossing and by having an unreasonable (Tibetan) longitude for the Grayson-Cooke county line crossing. Buttons are provided on the dialog to resolve these common errors. Once satisfied with the crossing information pressing Apply will load the data for use by CQ/X. The primary use of this data is in the calculation of an estimate of the distance to next county and the time to the next county. If this data is not available certain of the related display items in the GPS panel shown below will indicate N/A. Automatic county detection will continue to work since it is based only on current position and the polygon models of the counties. Top Performing Timing Analysis of the RouteYou've drawn your route on a Google Map and downloaded the lat/lon file describing the route and now it's time to check whether you will be able to drive the route in the alloted time considering the possible need to stop for gas, and/or to stop in short counties to work the pileup. Using the following dialog you setup the analysis by identifying the various parameters that will determine the time requirements.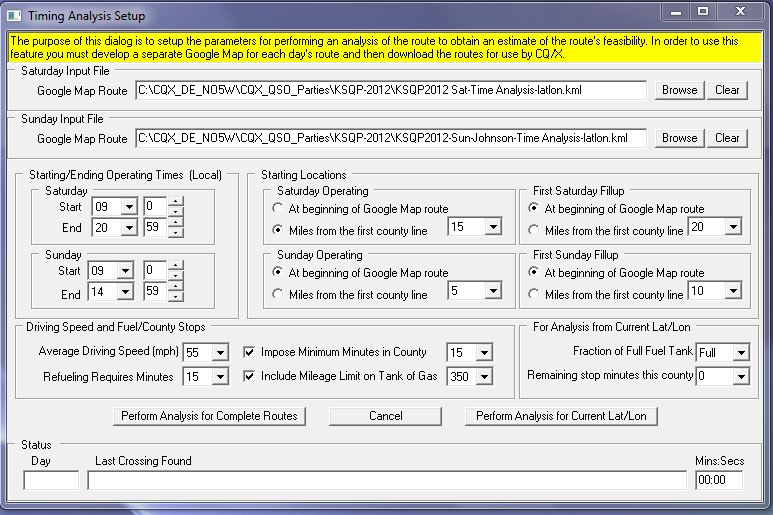 Clicking on the button labeled Perform Analysis for Complete Routes results in the following dialog which displays the results of the timing analysis. In this example the analysis has determined that on the Saturday route there will be 95 minutes available for stops, that there will be one required stop for gas, and three required stops in short counties in order to meet the requested minimum time in each county, leaving 50 minutes available for lunch/dinner or other miscellaneous stops. On this basis the route appears to be feasible but there will not be time for both a lunch and dinner break. 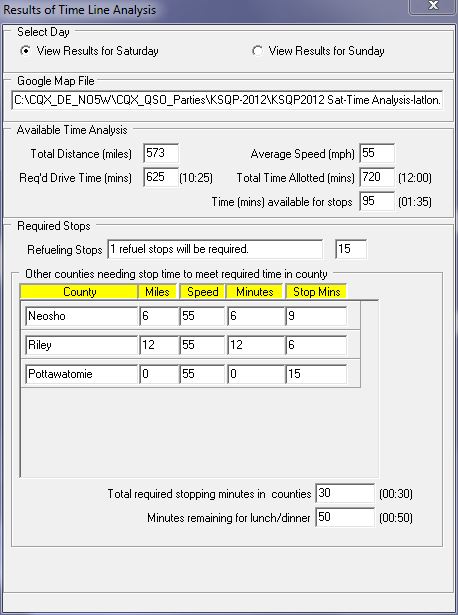 Top GPS Information Display on the Status Panel and in the QSO Entry AreaData received from the GPS as well as the results of calculations is shown on the GPS Status Panel that is contained in a tabbed display area on the left side of the main user interface screen. Here is a screen shot of that panel with a brief description of the most important items: This status is followed in the upper section by GPS outputs including number of satellites in view, time as provided by the satellite, latitude and longitude, and speed. Although heading is available as one of the GPS outputs the value shown on the GPS status panel is calculated from the two most recent positions reported by the GPS and the Grid Square is calculated from the latitude and longitude provided by the GPS. On the GPS setup menu the user can specify an alert range in miles and two update rates (periods) a nominal value and an alert value. When the distance to the next county is greater than the alert range the update period is set to the nominal value and when the distance becomes less than the alert range the update period is set to the alert value. This tends to reduce the effect of the speed of the moving vehicle on accuracy of the county changeover. The user can define any number of way points using a sub menu item from the GPS menu and during operation the combo box on the GPS status panel can be used to select the way point to monitor. The distance to the way point is shown just beneath the combo box. During the planning phase prior to the QSO party the user develops a route plan and, using a mapping program, converts that route into an ordered sequence of county line crossings. Although this information is not necessary for automatic county detection it is useful in calculating an estimate of the (radial) distance and time to the next county. The resulting distance is shown in the next section of the panel. The small circle next to the distance has three possible color values (green, yellow, and red) based on how well the number of QSOs in the current county is doing against a specified goal and the color of the circle indicates a recommendation to either continue at the current or higher speed, reduce speed, or stop. Details of how the color values are determined may be found in the help file. Total accumulated time in each county is maintained by the program and the value for the current county is shown in the next section. Also shown in this section is the estimated time to next provided that the closing speed toward the next county line crossing exceeds a certain user-configurable value. The current value of the closing speed is shown just below the time values. Just beneath this section is a panel showing the name of the next county line crossing in the format From County-To County - Hwy. When the distance to this crossing exceeds the alert range the panel is green and then turns red when the distance becomes less than the alert range. Just beneath the next county line crossing panel is a panel indicating the action the Automatic County Detection logic will take when it detects a new county. The action can have three possible values:
In order to tab the area taken up by the GPS Status panel to show other information such as the current score and progress against QSO goals for the county, the essential information from the GPS Status panel is also shown near the QSO Entry area as shown on the next screen shot. Staying on Track - Multi-Waypoint Tracker and Driver InterfaceYou've made a plan and intend to cover a large number of counties but it's going to be a tight schedule requiring a minimum number of missed turns. There are two features that assist in keeping on track -- one is the Multi-Waypoint Tracker and the other is an interface that will allow the driver to see important route information on an Android tablet or smartphone over a wireless connection. Waypoints are typically defined to include points where there is a change in highway. These can be identified using a mapping program like Streets and Trips. During the route planning phase a pushpin is placed at each waypoint with a descriptive label such as LT-I10-US59N (left turn from I10 to US59 North) and these waypoints can be exported from Streets and Trips and imported into CQ/X. Then the Multi-Waypoint Tracker can be used to provide a display similar to the one on the left below for use by the CQ/X operator. Here the operator has chosen to show the three closest waypoints. The distance to each will be updated on each cycle of the GPS data. As indicated on the display the operator can also elect to show all waypoints that are within a user-specified distance from the current point. 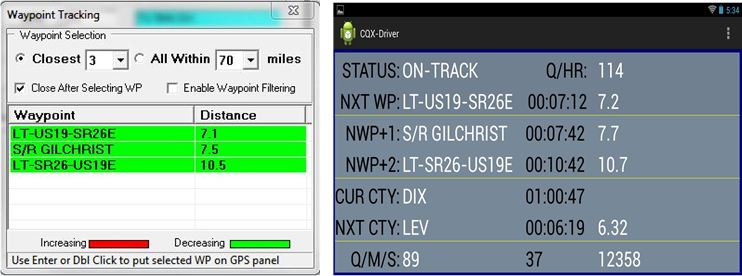 When the CQ/X-Driver interface is enabled similar information along with other information of importance to the driver is presented on the driver's Android smartphone or tablet as shown in the above screen shot. The first section of the driver's display indicates whether the driver is on the planned path, the current ten-minute rate (Q/HR), and the next way point (Left Turn from US19 to State Route 26 East), which, at current speed will be occuring in about 7 minutes and is about 7.2 miles down the planned track. The second section provides similar information for the waypoint after the next waypoint (Stop and Run Gilchrist in about 8 minutes with the planned stopping point about 7.7 miles down the track). The next section provides data on the current county (DIX and the station has already spent a little more than an hour in DIX) and the next county (LEV which is about 6 minutes down the track at current speed ). The final section shows the number of QSOs in the log, the number of mults and the current score. The CQX-Driver interface for Android devices and the CQ/X modifications required to support it require version 1.8.0 patched through 180-06 or later. Making QSOsYou've done your planning, built and validated the county line crossing file, and the countdown box is showing 00:00:00:00 (days:hours:minutes:seconds) until the start of your favorite QSO party. Your driver's awake at the wheel, you've hit the road and you've reached the starting point. It's time to make some QSOs -- how's that done?
 In this case the operator started out logging a contact with K5NG in GRAY but later determined that he was actually working K5NZ in GRIM. The screen shot was taken just prior to logging. It's twenty minutes later and you're racking up the Qs, you notice in the GPS panel that the next county is coming up in half a mile but you give out another CQ from your current county and a station comes back. You type in his call but he asks for a repeat and you send your exchange again -- this time using the function key you assigned to that purpose. He gets the exchange and sends his and you type the info in but you notice that the new county line just passed. You press enter and note from the log display that the contact was logged in the county it started in and the county you sent to the station. Then you hear going out in CW "NEW MGMY NEW MGMY" letting everyone know that you just entered a new county, MGMY. You glance at the message array and see that all the messages involving the current and next county are reflecting the new county values. The pileup begins anew -- yes! 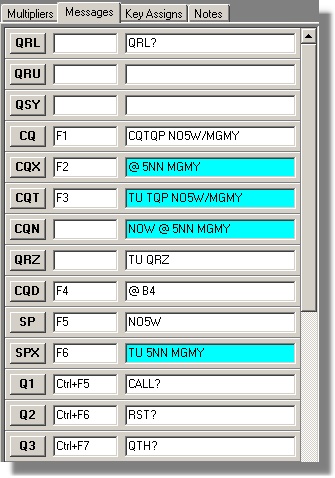 It's another twenty minutes down the road, conditions are great and you continue to rack up the Qs. You're working K4BAI and are about to send your thank you message to log the contact but you know from the GPS data immediately below the QSO Entry box that the next county line is in two minutes. Instead of sending the thank you message and logging the contact immediately you press Ctrl+N and the message goes out "WALL IN 2 MINS". You hear an "RR" from K4BAI and press the Enter key to log the contact and send the thank you message. Two minutes later you work K4BAI again as one of your first Qs in WALL, the new county. You're just into the new county now and have just worked K4BAI, the pileup is intense and you get a response from N4PN and you also copy K8MR calling. You type N4PN into the entry box and press the Enter key. While your exchange is going out you type in K8MR into the entry box and press the Enter key while holding down the Alt key. You then enter the exchange from N4PN and press enter. A brief TU goes out and a user-defined CQN "NOW" exchange message goes out with K8MR as the call and K8MR returns to the QSO Entry box. You enter and log K8MR in the normal way. Or you get a response from a station that is operating on a county line or intersection of two or more counties and he sends a single exchange containing all of the counties. You type them all into the QSO Entry box at the same time and press the key you have assigned to the task of logging multiple counties causing separate log entries to be made for each county. Or perhaps you're the operator sitting on an intersection of two or more counties. You call up a special dialog, define the counties you're operating from, and then proceed to efficiently work stations. Depending on the rules of the QSO party you either make individual QSOs for each county or elect to send an single exchange containing all of the counties. Top Finalizing the LogIt's the next day in this two session QSO party, the session clock is showing 00:00:00 and you've just finished making the last of your 1925 contacts. What a party it has been with 10, 15, 20, and 40 all open and stations actually on 10 and 15 -- [Ed: dreaming here]. It's time to finalize the log and send off a report to 3830. Using the Finalize logs item under the File menu you call up a dialog for preparing statistics, entering soapbox comments, and viewing a few lines of the Cabrillo log. After completing your soapbox comments you save the log to a location of your choice and send off an email to the party sponsor. Then you connect to 3830 using an item under the File menu and enter your results and commentary and submit.You're done with that one. Time to start thinking about where you'll go next and to start the planning process again. Top Making a GPS-Enabled QSLIt's a week later and you find a request to fill out an MRC from KO1U in your mailbox. You bring up the log, verify the contacts and check them off on the MRC and sign it. Then you notice that Mark took the time to work you more than 20 times during the party. So you decide to enclose 4-5 unique QSLs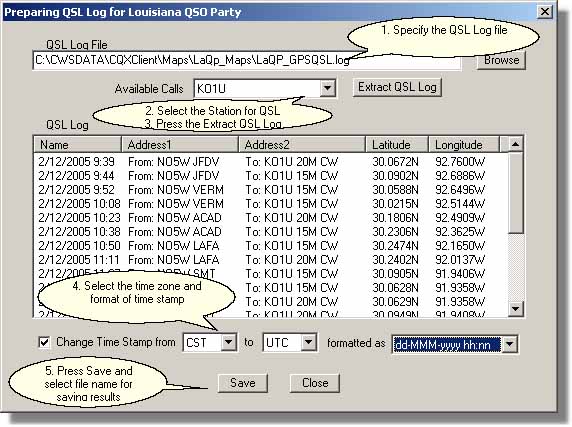 in the
return
envelope to KO1U, made possible because before starting the
contest you remembered to set up to log the latitude and longitude of
each contact . You go into the QP Tools menu and select
Prepare QSL
Log Files which activates the following dialog on which you've selected
KO1U.
in the
return
envelope to KO1U, made possible because before starting the
contest you remembered to set up to log the latitude and longitude of
each contact . You go into the QP Tools menu and select
Prepare QSL
Log Files which activates the following dialog on which you've selected
KO1U.You follow the steps indicated above and Save the results to a file of your choosing. The header at the top of the file is setup to enable importing the data into Streets and Trips (S&T) for a nice appearance in the S&T balloons. You open up S&T and import the resulting file. Then you fiddle with some options in S&T (hmm, let's see, do I want red cars, green cars, or blue cars this time) to get the appearance you want. Then you set a screen capture size (605x365 works well in my environment) in your favorite screen capture utility. You play with the S&T zoom level to get a pleasing display and maybe change the balloon orientations to fit better on your screen capture. When satisfied you capture the 1-4 QSOs on a single card and save the resulting as a jpg file for printing on blank stock -- e.g. 3x5 index cards or blank QSL stock if you've got some. You repeat the screen capture and printing process for the remainder of the KO1U QSOs. Some examples are shown on the QSL Gallery page. Posting Your Mobile Log On Google MapsIt's several weeks later and the log submission deadline has passed. You decide you would like to post your mobile log on the web in a searchable format and in a way that sho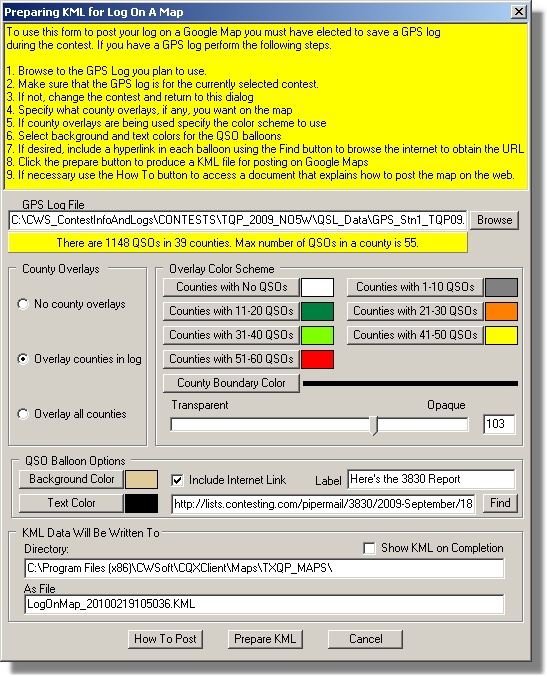 ws
the mobile nature of your adventure allowing users to see where you
were when they worked you and, if desired, to view the surrounding
countryside. You remembered to have CQ/X keep a GPS QSL log so
you've got lat/lon data for each QSO. You go into the QP Tools
menu and select
the menu item Prepare Log On A Map which activates a
dialog
for formating and preparing the KML file that you will publish using
Google Maps. ws
the mobile nature of your adventure allowing users to see where you
were when they worked you and, if desired, to view the surrounding
countryside. You remembered to have CQ/X keep a GPS QSL log so
you've got lat/lon data for each QSO. You go into the QP Tools
menu and select
the menu item Prepare Log On A Map which activates a
dialog
for formating and preparing the KML file that you will publish using
Google Maps.First it's necessary to make sure that the log you are going to post is for the contest that you currently have selected. If not you exit this dialog and use the New Contest item under the Files menu to select the contest that corresponds to the GPS log. This will ensure that correct county polygon data is loaded into the program. Once the GPS log file is selected it will be analyzed for number of counties, number of QSOs, and maximum QSOs in a county in order to determine the number of color coding selections that are needed. You can elect to include county overlays for all of the counties in the state, or for only those that you have activated, or no county overlays at all. If you choose to show overlays then you may want them to be color coded based on the number of QSOs in each. You select the colors to be used along with the color for the boundary line and the opacity/transparency of the overlay colors. You then select background and text colors for the QSO balloons that will be activated. You decide to include a hyperlink to the 3830 report that you filed earlier. You use the Find button to locate the URL for the report in the 3830 archives and then paste the URL into the edit box immediately to the left of the Find button. Finally you click on the Prepare KML button to produce the KML file which you then upload to your website. Using the information provided in the How To Post document you then request Google Maps to find the file and you use the link information provided by Google Maps to add a link to the map on a web page. The following screen shots show an example of the results. A QSO with a given station can be found using the standard 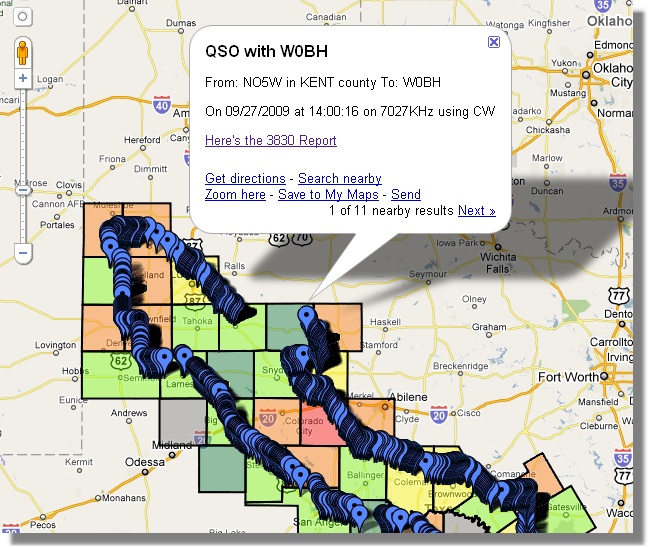 find
menu item resulting in a balloon at the location of the QSO. Of course
you can zoom in for a closer view as shown in the second screen shot.
You can also zoom in for a street level view using the symbol of the
little man just above the zoom control. find
menu item resulting in a balloon at the location of the QSO. Of course
you can zoom in for a closer view as shown in the second screen shot.
You can also zoom in for a street level view using the symbol of the
little man just above the zoom control.Note that when a number of QSOs have been made at or very near the same location only one place marker will be shown and the QSO balloons for the additional QSOs may be accessed using the nearby results link. Finally clicking on an area of a county rather than on a QSO placemarker will show the county identifier and the number of QSOs made in that county as shown in the final screen shot. Some "live" example Logs on a Map for several QSO parties I've done can be found on the Logs On a Map page. 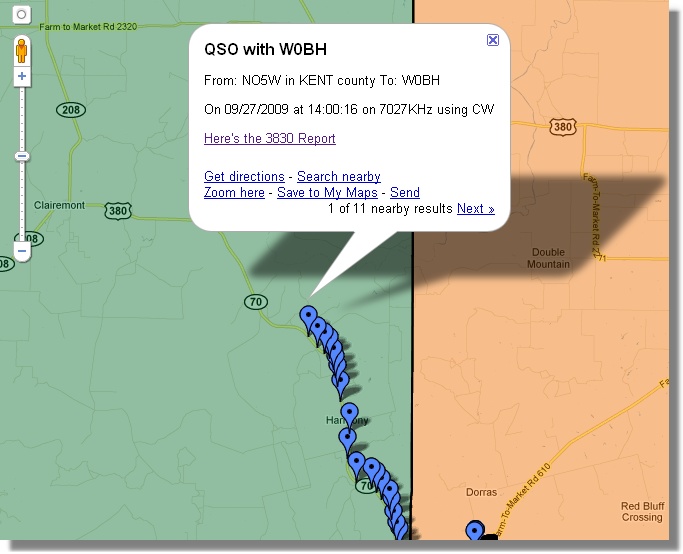 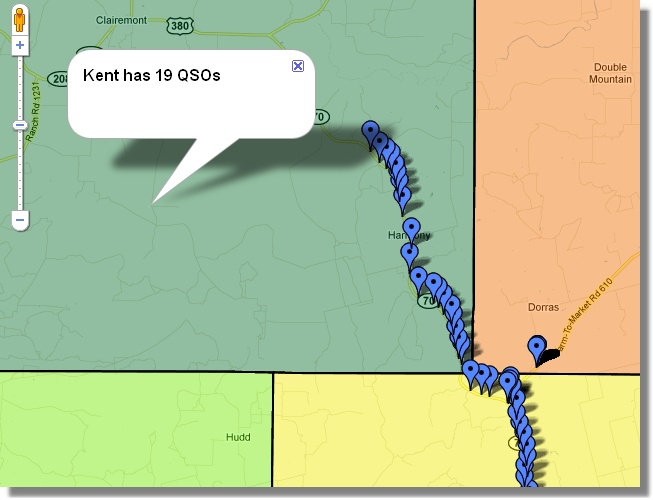 Mapping QSO Party Planned Operations Next year's QSO party is approaching and you've been assigned the task of publishing planned routes and fixed operations on the web. There are several features in the program to assist in publishing Google map based descriptions of these activities once you've built a database of plans sent in from the participants. After building the database, which could be a simple spreadsheet, you prepare a comma separated value Active Stations file with a single row for each county in the state having the following format: CountyFullName=Stn1,Stn2,Stn3,.... where Stn1, Stn2, etc is simply a listing of the stations that plan to be active from that county and can include an indication of whether they will be mixed mode, SSB-only, or CW-only and possibly days of operation. You've built the Active Stations file and are now ready to publish on the web. You call up the Plan Route dialog, a portion of which is shown below, and prepare a route containing all of the counties in the state by clicking on the Load All Counties button. This will load all of the counties overriding the requirement that the sequence of counties be adjacent. Once this is done you click on the button labeled Export Route As KML File to call up the Setting KML File Parameters dialog for specifying the contents of the KML file. 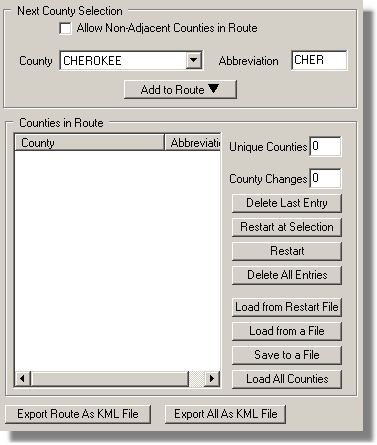 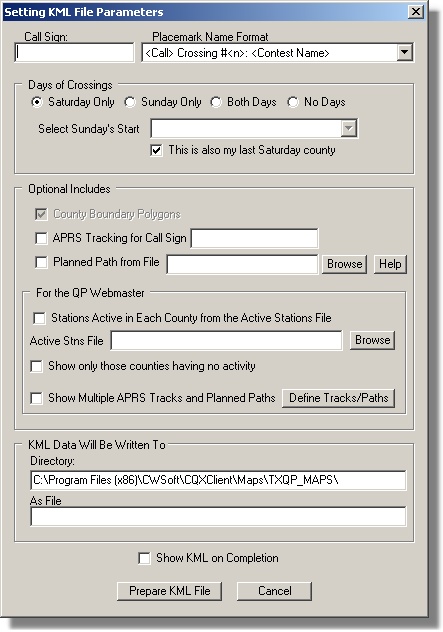 In the latter dialog you specify a file name by entering some identifier in the Call Sign window, you probably specify the No Days option in the Days of Crossing group, and then in the section labeled For the QP Webmaster under Optional Includes you select your desired options. For example to develop the KML for showing each of the counties in the state along with balloons showing stations planning to be active from each county you check the Stations Active in Each County box and then browse to the Active Stations file. Clicking on the button labeled Prepare KML File will then prepare and save the file in the specified location. On the other hand you might want to publish a map containing only those counties for which no operations have been announced. In that case you still need the Active Stations file but you check the box labeled Show Only Those Counties Having No Activity and then, of course click on the Prepare KML File button. If you have some stations that are APRS-capable and/or have prepared a Google map of their planned route and have communicated that information to you, you can build a map including that information by checking the box labeled Show Multiple APRS Tracks and Planned Paths. Then you click on the button labeled Define Tracks/Paths to specify the APRS call sign and the file where the link to the path of the planned route is stored. The latter file is something the other operators will have received from Google when they prepare the Google map of their planned route. The Help menu items Use Google Map to Define Mobile Route and Use Google Map to Show County Activity provide access to two pdf files containing detailed instructions for those applications of Google maps. Operating Multiple Concurrent QSO Parties It's an early May weekend with the 7QP, the New England QP, and the Indiana QP all going on simultaneously at some points during the weekend. You'd like to play in all of them so you fire up CQ/X, select the 7-NE-IN-QSOPARTY and join the fray logging all contacts into a single log. When you're done you use menu item File | Split Multi-Contest Logto prepare the final log for submission to each of the QSO parties. Later in August you do the same for the concurrent running of the Kansas, Ohio, and Hawaii QSO Parties. In addition to the two multi-QPs mentioned there are a number of other multi-QPs. See the Contests page for a listing of others. Additional details on this feature are described in the document Operating the Multi-QP Contests. Tracking Your Spelling Progress You're working one of the contests that has a series of special stations used to form a spelling feature -- examples include Florida with its FLORIDA QSO PARTY and Kansas with SUNFLOWER. In order to track your progress you use the Show Spelling Status menu item to bring up the following display and then can choose various modes (CW, PH, MX, Both) to show progress. 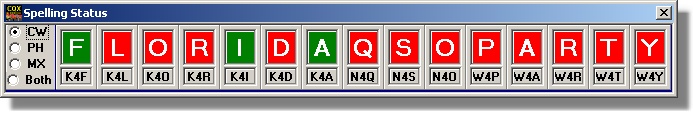 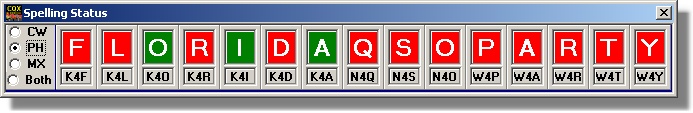 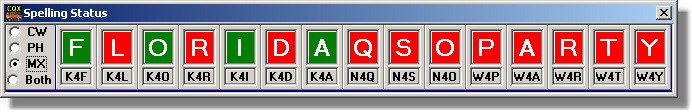 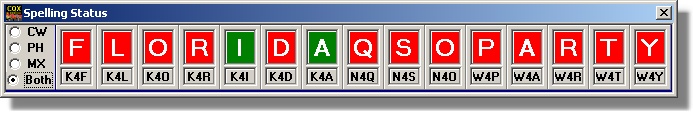 Here we see that the operator has worked K4F, K4I, and K4A on CW and K4O, K4I, K4A on phone. On CW or Phone the operator has worked K4F, K4O, K4I, and K4A, whereas the operator has only worked K4I and K4A on both modes. Top Copyright: C.W. Sanders, NO5W Last Updated: 16-July-2013 |
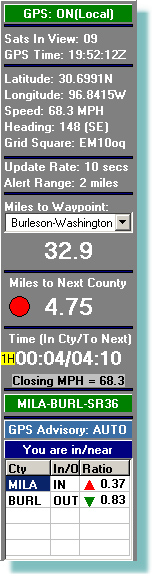 At
the very
top of the panel is an
indication of whether the GPS is OFF, ON(Local) which means
the client is receiving data via a direct connection to the GPS, or
ON(Remote) which means the client is receiving GPS data from the server
module over a network with the server module providing the direct
connection to a single GPS.
At
the very
top of the panel is an
indication of whether the GPS is OFF, ON(Local) which means
the client is receiving data via a direct connection to the GPS, or
ON(Remote) which means the client is receiving GPS data from the server
module over a network with the server module providing the direct
connection to a single GPS. 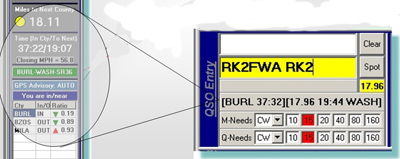 The
entries in the left hand bracket are the name of the current
county and the accumulated time in the current county. The three
entries in the right hand bracket are the distance to next county, the
estimated time to the next county and the abbreviated name of the next
county.
The
entries in the left hand bracket are the name of the current
county and the accumulated time in the current county. The three
entries in the right hand bracket are the distance to next county, the
estimated time to the next county and the abbreviated name of the next
county.