|
|
|
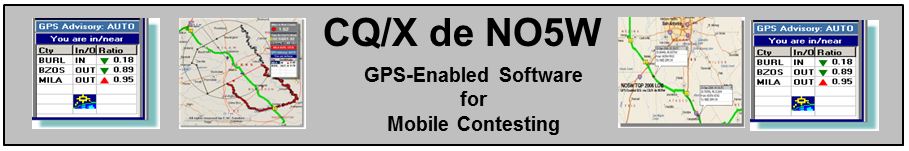
GPS Information Display |
|
|
Data
received from the GPS as well as
the results of calculations are
shown on the GPS Status Panel that is contained in a tabbed display
area on the left side of the main user interface screen. Here is a
screen shot of that panel with a brief description of the most
important items:
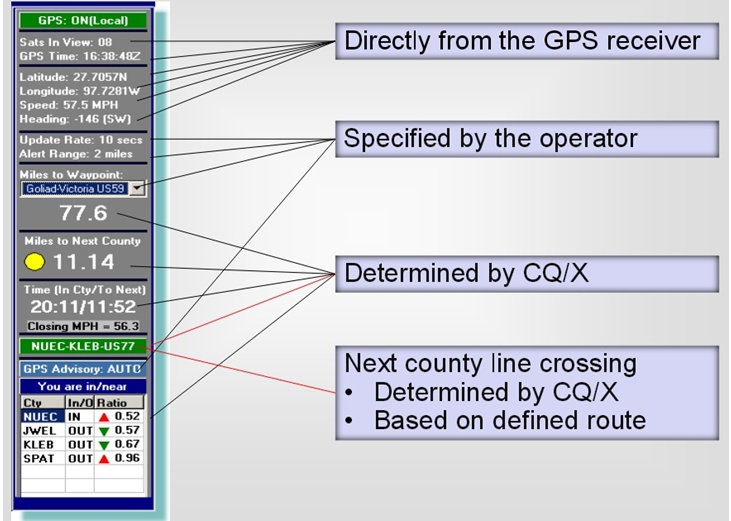 At the very top of the panel is an indication of whether the GPS is OFF, ON(Local) which means the client is receiving data via a direct connection to the GPS, or ON(Remote) which means the client is receiving GPS data from the server module over a network with the server module providing the direct connection to a single GPS. This status is followed in the upper section by GPS outputs including number of satellites in view, time as provided by the satellite, latitude and longitude, speed, and heading. The Grid Square is calculated from the latitude and longitude provided by the GPS. On the GPS setup menu the user can specify an alert range in miles and two update rates (periods) a nominal value and an alert value. When the distance to the next county is greater than the alert range the update period is set to the nominal value and when the distance becomes less than the alert range the update period is set to the alert value. This tends to reduce the effect of the speed of the moving vehicle on accuracy of the county changeover. The user can define any number of way points using a sub menu item from the GPS menu. During operation either the combo box on the GPS status panel can be used to select the way point to monitor or the waypoint may be selected from the Multi-Waypoint Tracker if it is being used. The distance to the selected way point is shown just beneath the combo box. During the planning phase prior to the QSO party the user develops a route plan and, using a mapping program, converts that route into an ordered sequence of county line crossing lat/lon points. Although this information is not necessary for automatic county detection it is useful in calculating an estimate of the distance and time to the next county. The resulting distance is shown in the next section of the panel. The small circle next to the distance has three possible color values (green, yellow, and red) based on how well the number of QSOs in the current county is doing against a specified goal and the color of the circle indicates a recommendation to either continue at the current or higher speed, reduce speed, or stop. Details of how the color values are determined may be found in the help file. Total accumulated time in each county is maintained by the program and the value for the current county is shown in the next section. Also shown in this section is the estimated time to next provided that the closing speed toward the next county line crossing point exceeds a certain user-configurable value. The current value of the closing speed is shown just below the time values. Just beneath this section is a panel showing the name of the next county line crossing in the format From County-To County - Hwy. When the distance to this crossing exceeds the alert range the panel is green and then turns red when the distance becomes less than the alert range. Just beneath the next county line crossing panel is a panel indicating the action the Automatic County Detection logic will take when it detects a new county. The action can have three possible values:
At the bottom of the GPS Status
panel is a grid showing the results of
the automatic county detection with the current county (the IN county)
being always shown at the top of the list followed by other counties
whose circumscribing circles contain the current position but failed
the wrapping number analysis described on the Technical
page. The ratios in the grid indicate the distance from the current
point to the center of the county's circumscribing circle as a fraction
of the total radius of the circle and the arrows indicate
whether
this ratio is increasing or decreasing on the last two updates. Of
course as the ratio associated with a county reaches 1.0 the county
will fall off the list.
Copyright: C.W. Sanders, NO5W Last Updated: 26-April-2020 |
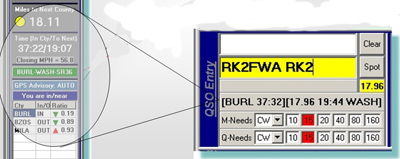 In
order to tab the area taken up by the GPS Status panel to show other
information such as the current score and progress against
QSO goals for the county, the essential information from the GPS Status
panel is also shown near the QSO Entry area as shown on the next screen
shot. The
entries in the left hand bracket are the name of the current
county and the accumulated time in the current county. The three
entries in the right hand bracket are the distance to next county, the
estimated time to the next county and the abbreviated name of the next
county.
In
order to tab the area taken up by the GPS Status panel to show other
information such as the current score and progress against
QSO goals for the county, the essential information from the GPS Status
panel is also shown near the QSO Entry area as shown on the next screen
shot. The
entries in the left hand bracket are the name of the current
county and the accumulated time in the current county. The three
entries in the right hand bracket are the distance to next county, the
estimated time to the next county and the abbreviated name of the next
county.